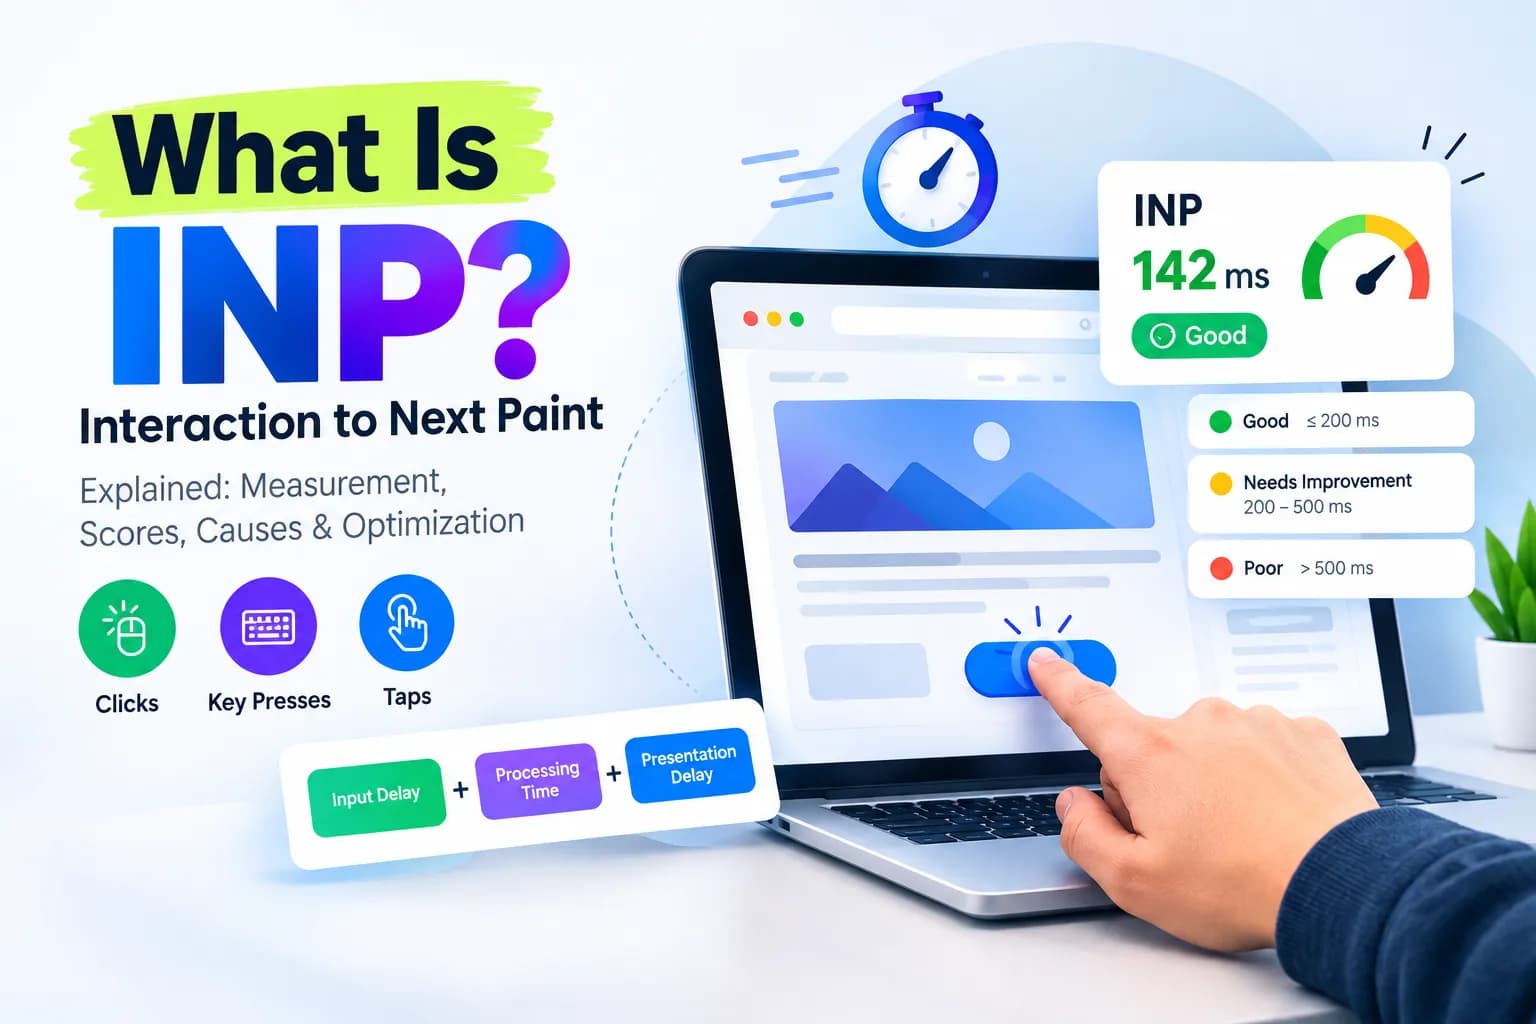
INP stands for Interaction to Next Paint, a Core Web Vitals metric to measure load response time to user interaction, including clicks, taps, or keystrokes, to the next rendering of the web page. INP is unlike standard page load metrics, as load time only evaluates page responsiveness upon page load, whereas INP evaluates responsiveness throughout real user interaction with the page. Google considers INP with page experience metrics because a page that takes seconds to load, but almost exceeds the user's SLA for responsiveness when clicked, still negatively impacts the user experience.
INP stands for Interaction to Next Paint, a Core Web Vitals metric to measure load response time to user interaction, including clicks, taps, or keystrokes, to the next rendering of the web page. INP is unlike standard page load metrics, as load time only evaluates page responsiveness upon page load, whereas INP evaluates responsiveness throughout real user interaction with the page. Google considers INP with page experience metrics because a page that takes seconds to load, but almost exceeds the user's SLA for responsiveness when clicked, still negatively impacts the user experience.
Understanding INP: Measurement, Scores, Causes & Optimization
What Is INP (Interaction to Next Paint)?
Before getting into measurement and optimization, it helps to understand what this metric represents and why it exists in the first place.
INP Meaning and Definition
Interaction to Next Paint (INP) captures the time it takes the browser to respond to a user's interaction by rendering the next iteration of the page. A 1 second response time for a button click would be captured by INP. INP is unique because rather than focusing on a single button click, it tracks a user's interaction over the course of a page's lifetime and captures the worst, or near worst, interaction as the representative page load time. This captures the performance of the page as it's actually used.
What Does INP Stand For?
INP, short for Interaction to Next Paint, describes the time it takes to process user input by the browser and reflect that input by updating the browser's display. The word "Interaction" literally means user input, while the word "Next Paint" refers to the next frame a browser renders after processing user input. INP is a metric to evaluate the time it takes to process an interaction and the resulting display of that input.
Why Google Replaced FID with INP
Google has recently abandoned First Input Delay (FID) for measuring responsiveness. FID only tracks the delay in the browser's reaction to the first user interaction on a page, and thus, overlooks much of the ‘real-world’ lag that may occur late into a session. INP will roll out in March 2024 and intends to fill that gap by measuring interactions along the entire duration that a page is visited. This may help site owners with a better understanding of page behavior as users navigate through the page by interacting with it, such as page scrolling and interactions via keyboard input.
INP as a Core Web Vitals Metric
Now that the basic definition is clear, it's worth breaking down how INP actually gets calculated and what counts toward it.
How INP Measures User Interaction (Input Delay, Processing Time, Presentation Delay)
INP consists of input delay, processing time and presentation delay. Add the three delays together, and you have the total INP for that given interaction. Input delay is how long the browser takes to process the user's given instruction. Processing time is the execution time of the event handler and the associated JavaScript code. Presentation delay is how long the browser takes to paint the new frame after the processing is complete.
Which Interactions Count Toward INP (Clicks, Key Presses, Taps)
INP differentiates itself from other tracking tools. INP tracks clicks, taps, and key presses. Users notice these the most when a page is unresponsive, therefore INP has chosen to track these. Scrolling and hovering behaviors are not tracked since they are browser-specific UI behaviors and do not require the same event handler processing.
INP Score Thresholds (Good, Needs Improvement, Poor)
Google categorizes INP scores into three ranges:
- Good: 200 milliseconds or less
- Needs Improvement: between 200 and 500 milliseconds
- Poor: above 500 milliseconds
A page with good responsiveness typically keeps interactions under that 200ms mark for most users.
INP vs FID: What Changed and Why It Matters
INP and FID both measure how quickly pages react to user input, but they do so slightly differently. FID looks at the time it takes for the browser to begin processing an initial click. INP expands on this by measuring the time it takes to process a click all the way to the next page render. INP's approach is useful for a few reasons, but mostly because the browsers may have optimized the first click so the remainder of the page may struggle to perform optimally or may respond very slowly to input.
Why INP Matters for SEO and User Experience
Understanding the mechanics of INP only matters if you also understand its real-world impact.
INP's Role in Google Search and Page Experience
INP is another of the three Core Web Vitals measurements along with Largest Contentful Paint (LCP) and Cumulative Layout Shift (CLS). content still holds the most value to rankings of pages in Google Search results. However, Google Search Central has stated that ranking pages has a lot to do with experiences users encounter with page responsiveness, and relevant measurements of page experiences are important especially when pages in search results are almost of the same value.
How Poor Responsiveness Affects User Experience
The loss of responsiveness is apparent and noticeable to users. One example is a tap on a button that doesn’t have visible and immediate feedback. Lagging dropdown menus, and forms that ignore key input are examples of this. This type of friction will eventually lead the user to distrust the site and feel that the entire site and its content is unreliable.
INP and Real User Monitoring (Field Data vs Lab Data)
The best way to measure INP is by using real user monitoring, since the responsiveness of websites can be impacted by the device, browser, and the network of each individual visitor. Lab data, or testing data generated in a controlled environment, tend to be less reliable than field data collected over time because the actual user interaction data is less likely to be simulated.
How to Measure and Monitor Your INP Score
Once you understand what INP measures, the next step is knowing where to check it.
Using Google Search Console's Core Web Vitals Report
Core Web Vitals report in Search Console evaluates pages based on data from Chromium based browsers. Generally site owners look at this report first to find Check INP issues for their whole domain and not for individual URLs.
Using Chrome DevTools (Performance Panel and CPU Throttling)
The Performance panel in Chrome DevTools records sessions to show input delays, processing times, and presentation delays for all user interactions. If you use DevTools to slow down your CPU, you can experience old device-like INP issues. This can help you fix INP issues that happen on fast development machines. However, real devices experience these issues.
Using Google Analytics and Google Tag Manager for INP Tracking
Many teams incorporate Google Analytics with a custom HTML tag or rely on Google Tag Manager to send INP data as part of their performance tracking and reporting tools suite. Tracking INP data means components of the platform can be evaluated relative to user engagement and platform responsiveness. This data can be collected and analyzed in the context of other user engagement and behavior data.
Understanding the 75th Percentile in INP Reporting
Evaluations for INP place Google at the 75th percentile of interactions. This means that at least 75 percent of interactions for one page must be considered "good" before a page can be declared to have “good responsiveness”. This means that a single ‘bad’ interaction on an otherwise good page will not affect the page’s overall responsiveness.
Common Causes of Poor INP (What Slows Down Interactions)
Several recurring issues tend to show up whenever INP scores fall into the "needs improvement" or "poor" range.
Long JavaScript Tasks Blocking the Main Thread
High INP scores have many root causes, and one of the most common is blockage of the browser main thread by JavaScript code, which stops the browser from interacting with the user.
Heavy Event Handlers and Function Calls
Handlers that involve several functions, especially functions that modify the DOM, or use a significant amount of calculations, will increasing the processing time for a single interaction.
Third-Party Scripts and Tags
Third party scripts, such as ad networks, chat widgets, or tracking pixels, often compete for the same main thread resources as your own code. A page loaded with third-party tags frequently shows worse INP scores than a leaner equivalent.
Large or Complex DOM Updates After Interaction
When a large amount of a webpage must re-render (e.g., large lists and tables), it takes longer for the browser to calculate and paint the changes, and thus introduces increased presentation delay.
How to Improve INP (Practical Optimization Guide)
Improving INP usually comes down to reducing how much work happens on the main thread during and after user interactions.
Break Up Long JavaScript Tasks
Use scheduler.yield and Similar Techniques: Using scheduler.yield or any similar scheduling technique, you can set up your browser to handle several smaller actions instead of handling only one large action that will take a while to finish.
Avoid Blocking the Browser Main Thread: Background tasks that aren't time-bound to the main thread must be moved away from the main thread. The main thread, should it become blocked, won't be able to respond to user inputs, even if the remaining components of the page are rendering at high speeds.
Optimize Event Handlers
Debounce or Throttle Frequent Events: For interactions that fire repeatedly, such as typing or resizing, debouncing or throttling the event handler prevents the browser from processing far more function calls than necessary.
Minimize Work Inside Event Handlers: Keeping event handlers lean, and offloading heavier logic to run after the next paint, helps the browser deliver visual feedback faster.
Reduce Third-Party Script Impact
Audit and Limit Third-Party Tags: Regularly auditing which third-party scripts are actually necessary can help identify ones that are dragging down page responsiveness without adding real value.
Load Non-Essential Scripts Asynchronously: Loading scripts asynchronously, or delaying them until after the main content is interactive, keeps them from competing with critical interactions for main thread time.
Offload Work with Web Workers
Web Workers execute JavaScript in a different background thread. As a result, web pages can process a large amount of background work and then render the rest of the page. Workers can improve INP for pages that need significant data processing or complex calculations.
Provide Fast Visual Feedback to Users
While there is a bit of a delay in processing, users notice and appreciate visual confirmation that their inputs have been processed. This is shown by a simple button that changes state, and can improve overall "responsiveness" while the processing and task completions still may take time.
Best Practices for Maintaining Good INP Performance
Optimizing INP once isn't the end of the work. Site performance shifts as new features, scripts, and content get added.
Setting Up Ongoing Real User Monitoring
Real user monitoring should run continuously rather than as a one-time check, since INP scores can change as traffic patterns, devices, and code evolve.
Debugging INP Issues with Debug Data and Attribution
Tools that offer debug data and data attribution, for example the web-vitals JavaScript library, are built to pinpoint poor INP scores. These debug tools show both the interaction and the DOM element that caused the poor INP score, as well as a debug location in the code.
Common Mistakes That Hurt INP (and How to Avoid Them)
Habits that consistently put INP scores in the good range include not overstuffing web pages with third-party tags without auditing, not writing long unbroken JavaScript tasks, and testing across devices with throttling and of varying speeds and capability. Breaking these habits will otherwise result in consistently putting your INP scores in the bad range.
Conclusion
A page's Interaction to Next Paint (INP) captures how quickly a page responds to real user actions. It allows teams to measure whether a page has a snappy user experience. A good INP score involves careful management of main thread work. There are several approaches that help address the main thread work including breaking tasks into smaller chunks, removing third-party code, and providing prompt visual feedback to users. In order to address performance issues during main thread work, you can use tools in Search Console, Chrome DevTools, or your analytics tool and optimize your site to offer a snappy experience to your users.
What is a good INP score?
A good INP score is 200 milliseconds or less. Scores between 200 and 500 milliseconds need improvement, and anything above 500 milliseconds is considered poor.
What is the difference between INP and FID?
FID only measured the delay before the browser processed the very first interaction on a page. INP measures the full response time, including processing and presentation delay, across all interactions throughout the page visit.
Why did Google replace FID with INP as a Core Web Vital?
Google made the switch in March 2024 because FID missed responsiveness issues that happened after the first interaction, while INP captures a much more complete picture of how a page performs during actual use.
How do I fix INP issues on my website?
Focus on breaking up long JavaScript tasks, optimizing event handlers, reducing third-party script load, and offloading heavy work to a web worker where possible.
Does third-party JavaScript affect my INP score?
Yes. Third-party scripts often compete for main thread resources, and pages with heavy third-party tag usage frequently show worse INP scores than leaner pages.
Can Google Analytics show me my site's INP performance?
Yes, many site owners connect INP tracking to their Google Analytics account using Google Tag Manager or a custom HTML tag to monitor responsiveness alongside other engagement metrics.
What causes the "INP issue: longer than 200ms" warning?
This warning appears when an interaction takes longer than the "good" threshold to result in a visible screen update, usually due to long JavaScript tasks, heavy event handlers, or third-party scripts blocking the main thread.